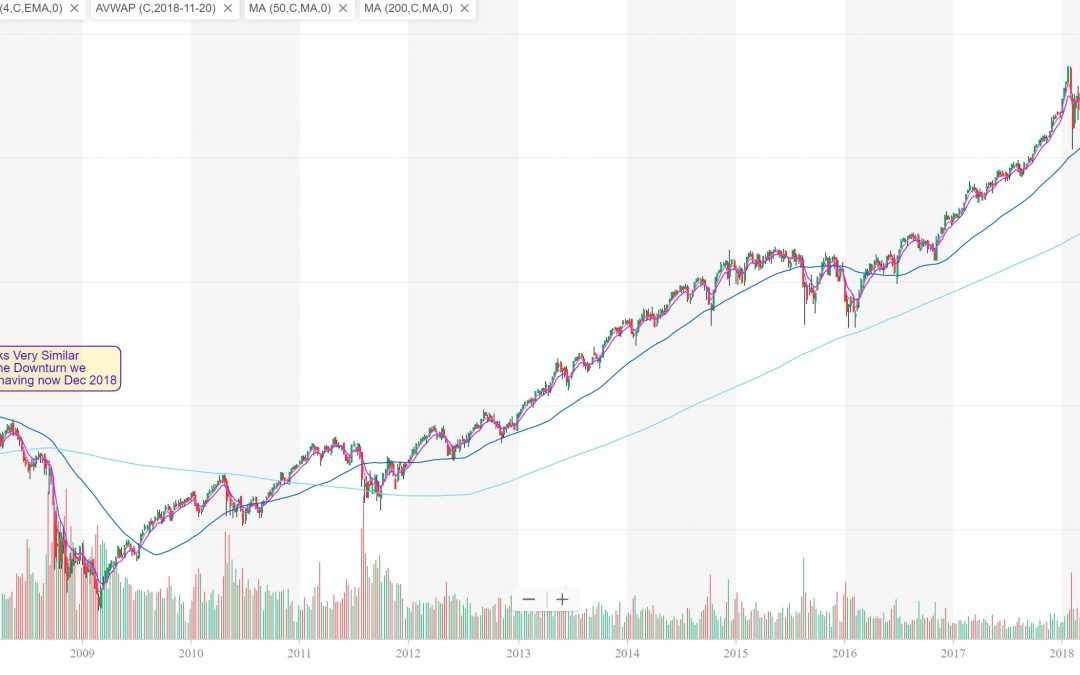
Back on December 13th I noticed the similarities of the crash of 2008/09 and posted on Twitter.

Sure enough we are starting to see the breakdown on the entire market. Im looking into the past to potentially see if the pattern repeats itself it looks like we could break the 200 SMA on weekly chart below and see a big downturn before we see the bottom.
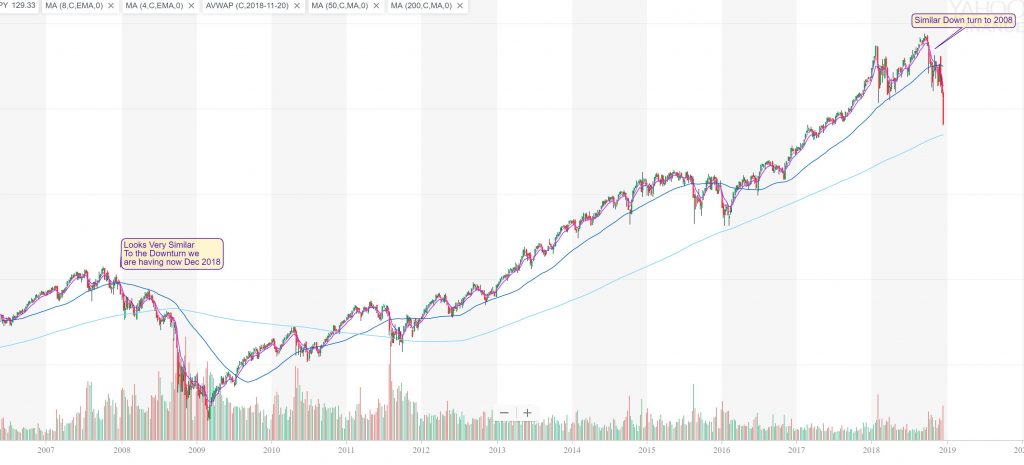
In looking at the past to potentially see the pattern of the future it looks like we will test the 200 SMA on the weekly chart and then test the 50 SMA and if we break 200 SMA again watch out below.

The 50 SMA on the weekly is 274.55 which we broke earlier in December. The 200 weekly SMA is at 234.53 which we could hit potentially this week and then a bounce back up to 50 SMA and a further huge drop down like in 2008 where the support was below the support of 2003 of 67.10….This is proving we could see a very couple of ugly bearish market months to years ahead if the market doesnt break up above the 50 SMA on the weekly chart. I will be on watch and sharing my opinion weekly as it happens. Bottom line is the market is always right and go with the trend.
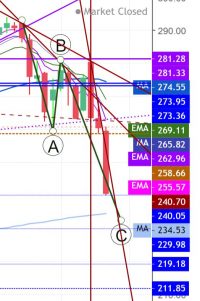
Below is another bigger picture view to see the support levels on the way down.

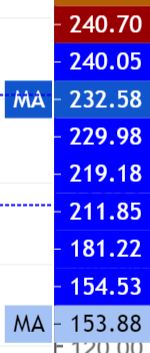
On the left is a blow up of support levels from the chart above. On Friday 12.21.18 we closed at 240.70. The royal blue are the support levels and the light blue is 200 Monthly SMA and the peacock blue is the 50 Monthly SMA to watch in the down trend. I would not be suprised if into Jan and Feb we go all the way down to 200 SMA of 154.
The tool I use for scanning and alerting is Trade Ideas who offer an always free trading room. 25% Off First Month or First Annual – Promo Code HOLLYCHRISTMAS25 through Christmas Day
I’m also offering 20% off my site through Christmas Day for my book or my watchlist with promo code SANTA
I love hearing feedback from you. It makes my trading more personal and I like to hear how I can help you. If you have quest.ions or comments you can contact me here or on Profitly, Twitter (@jane_yul), Instagram (missairplanejane), LinkedIn and Facebook (@sugarairplanejane). carpeprofit@gmail.com or YouTube
My book is available at Amazon FMJ Trust Transition Trade: How Successful Traders Said It, Did It, and Lived It . As well as Barnes and Noble, Indigo, Chapters,and more.
For my charts I use tradingview.com which offer free charting and paid services
Also Stocks To Trade that has a 1 week $1 trial
For the fastest level 2 I have found I use Equityfeed.
This blog is for information purposes. I am not a registered securities broker-dealer or an investment adviser. The information here is not intended as securities brokerage, investment or as an offer or solicitation of an offer to sell or buy, or as an endorsement, recommendation or sponsorship of any security or fund.