We are at a crucial point in the market right now and looking back 1 year it might be more important than we know. I was looking at the Natural Gas levels last year for a seasonal trade on gas and noticed that the high of the begining of the year was Jan 29th and then almost a month long trade to Feb 15th for a low before finding a bottom.
I then began curious to know if somehow the gas futures could also correspond to the market action as well. Sure enough I looked back at the $SPY for Jan 2018 and noticed that yes the high of the market for the beginning of the year was on Friday Jan 26th for a high of and then dropped down to find a new low. Sure enough it peaked at End of Day on the 4th friday of the month and then found a bottom on Feb 9th around 1pm.
When I look back historically at this time frame there doesn’t seem to be an exact drop amount. For 2017 there was a new high on the 26th to only have a 5 day pull back.
When I calculated the drop from last Jan 26th Close of 286.58 to the close of Feb 8th of 257.63 that equates a 10.10% drop. If history repeats itself and we have a High close of the price action of me writing this right now of 266.11 and we have the same 10.10% drop in the market to Feb 8th we are looking at a price of roughly 239.23. So this Friday last year was a very crucial point in the market. The past two weeks seems like a positioning for the big guys in moves to either the upside or the downside.

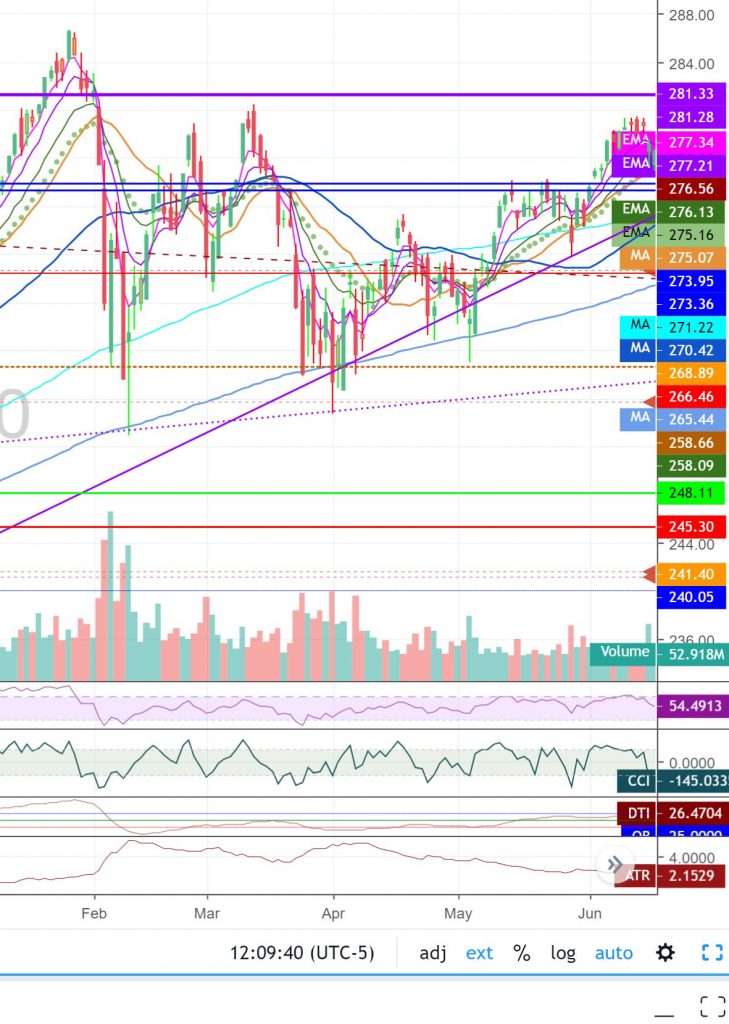
In the $SPY weekly chart you can see we are currently at a resistance point and for the past the week we have really consolidated price action between the 8ema 261 to the 21 ema of 266.84. There feels like there is tension here in the market to surge higher or to break down from the resistance we shall see we we go Monday. For sure there will be a big move coming it is will we break up to the 50 SMA of 272.76 for a test or back down to 235.79 200 SMA. Wow look at that coincidence. a 10.10% drop would have us close at 239.23 4 points away from 200 SMA.
The market will definitely decide and for those that like to put on lotto trades with options you might want to consider a SPY lotto put of 239 for Feb 15th for .27.
My last blog post I mentioned in 2008 we dropped to 200 SMA on weekly and then to 50 SMA and down to 50% valuation of the SPY. Lets see where we go from here. For now we might have that surge to 272 and then drop to 150. Love tracking the action and trading what the market gives each day.
I love hearing feedback from you. It makes my trading more personal and I like to hear how I can help you. If you have quest.ions or comments you can contact me here or on Profitly, Twitter (@jane_yul), Instagram (missairplanejane), LinkedIn and Facebook (@sugarairplanejane). carpeprofit@gmail.com or YouTube
The tool I use for scanning and alerting is Trade Ideas who offer an always free trading room. They are having their first Full Access Test Drive Feb 4th-8th to try out their software in live action
My book is available at Amazon FMJ Trust Transition Trade: How Successful Traders Said It, Did It, and Lived It . As well as Barnes and Noble, Indigo, Chapters,and more.
For my charts I use tradingview.com which offer free charting and paid services
Also Stocks To Trade that has a 1 week $7 trial
This blog is for information purposes. I am not a registered securities broker-dealer or an investment adviser. The information here is not intended as securities brokerage, investment or as an offer or solicitation of an offer to sell or buy, or as an endorsement, recommendation or sponsorship of any security or fund.
Start writing or type / to choose a block