This weekend being Martin Luther King weekend we had an extra day off from the market. As always in doing my prep for the weekend, I review the headlines on FinTwit. Yes, I check out what others are posting and talking about on Twitter.
Sure enough I saw this one tweet and I thought to myself this might be the top of the market.
In seeing this and the chart above it makes you wonder. The big guys in the market always take it to a new high before we sell off. So I began doing more research in the market. I like checking yahoo finance on my phone as I tend to see extra signs in the charts.
Stock Chart Signals
The chart below shows exactly what I’m talking about. This is a 15 min chart of the SPY ETF or S&P 500 Equity Traded Fund. The Candlestick highlighted shows 36.38 million shares traded in a 15 min timeframe between 331.6-331.79. Now when you do the math that is roughly 12 Billion USD traded in 15 minutes.
These above normal volume candles catch my eye and make me wonder where are we going to go from here. If you have followed my journey you know that I now more than every I pay attention to the volume, especially from the dark pool.
Well this was the first sign for me to keep my eyes peel. So I put on my inspector glasses on to find more abnormal volume candlesticks.
Fear could be present in the market
Sure enough after doing a bit more research I discovered another above normal volume candlestick on VXX or fear ETF. And it wasnt a small amount. On Tuesday Jan 14th we had a 5.2 million Candlestick on VXX at 1:30 pm with the price range of 13.53-13.84
In seeing fear and big prints timing together it makes me think a big position is being placed by the big guys. So I kept my eyes out for more price action today the 21st of January.
More Above Average Volume in the Market
That’s right one week after that 5.2 million candlestick on the VXX we have two more today January 21st, 2020. Today we had a bunch of 1 million candlesticks on the 5 min chart and the 3rd chart is the daily chart with increasing volume of 40.85 million in total today. On Friday we had 33 million shares traded. Today we also seemed to have bounced up off the bottom of VXX.
Will this be a repeat of October 2018?
Is this the beginning of the recession 2020?
We shall see. Here are more big volume candles on the indexes today and this could be the market repositioning. There was 7 million on the SPY after the 36 million on Friday 331.14-331.37 for the DIA or the Dow Jones ETF there were two bigger than normal candlesticks one at 9:35am and one at 1:55pm. for 400K 292.78-293.10 and 650K 291.65-292.06.
Are all these higher than normal candlesticks the top for us? Looking at these charts when we see the DIA drop below 291.5 and SPY below 331 and VXX above 13.85 we will likely see the market drop in value. It wouldn’t be suprising to see a bit of a pullback as the SPY has been climbing up and up and up since 12/03/19. We might see a test of 324.5 and then 317.50.
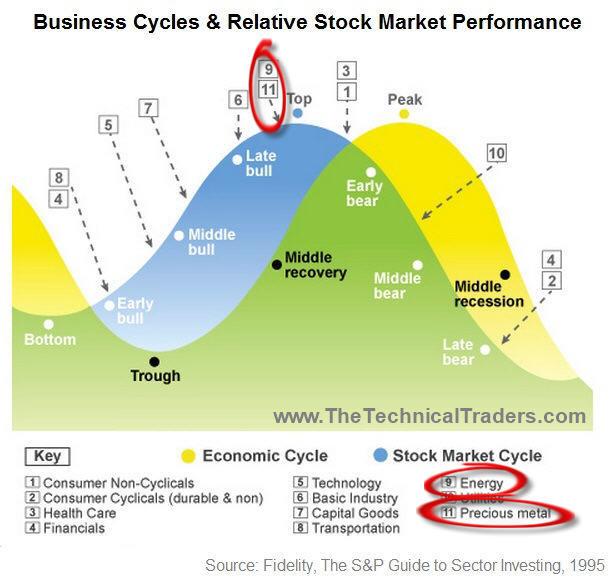
Where is the money going?
Looking at this chart maybe they are putting their money into precious metals and Energy sector? Either way I’m ready as I watching for these high volume candlesticks.
Let me know your thoughts in the comments below.
I love hearing feedback, so please share. You can also contact me on my social media accounts Twitter (@ItsAirplaneJane), Instagram (missairplanejane), LinkedIn and Facebook (@sugarairplanejane) or YouTube
The tool I use for scanning and alerting is Trade Ideas who offer an always free trading room. You can receive 5% off with Promo code CARPEPROFIT15 all caps when you sign up here for your first year or month
Trade Ideas will be offering the quarterly full access test drive of their software their software in Nov 2019 for the cost of data fees $9.
Another amazing software is Trendspider that has a new innovative rain drop candlestick that shows the volume for the morning session and afternoon session as far as the weight of it in price action. You can try them for free for 7 days here and receive 20% off with MTS20
This blog is for informational and educational purposes. I am not a registered securities broker-dealer or an investment adviser. The information here is not intended as securities brokerage, investment or as an offer or solicitation of an offer to sell or buy, or as an endorsement, recommendation or sponsorship of any security or fund.
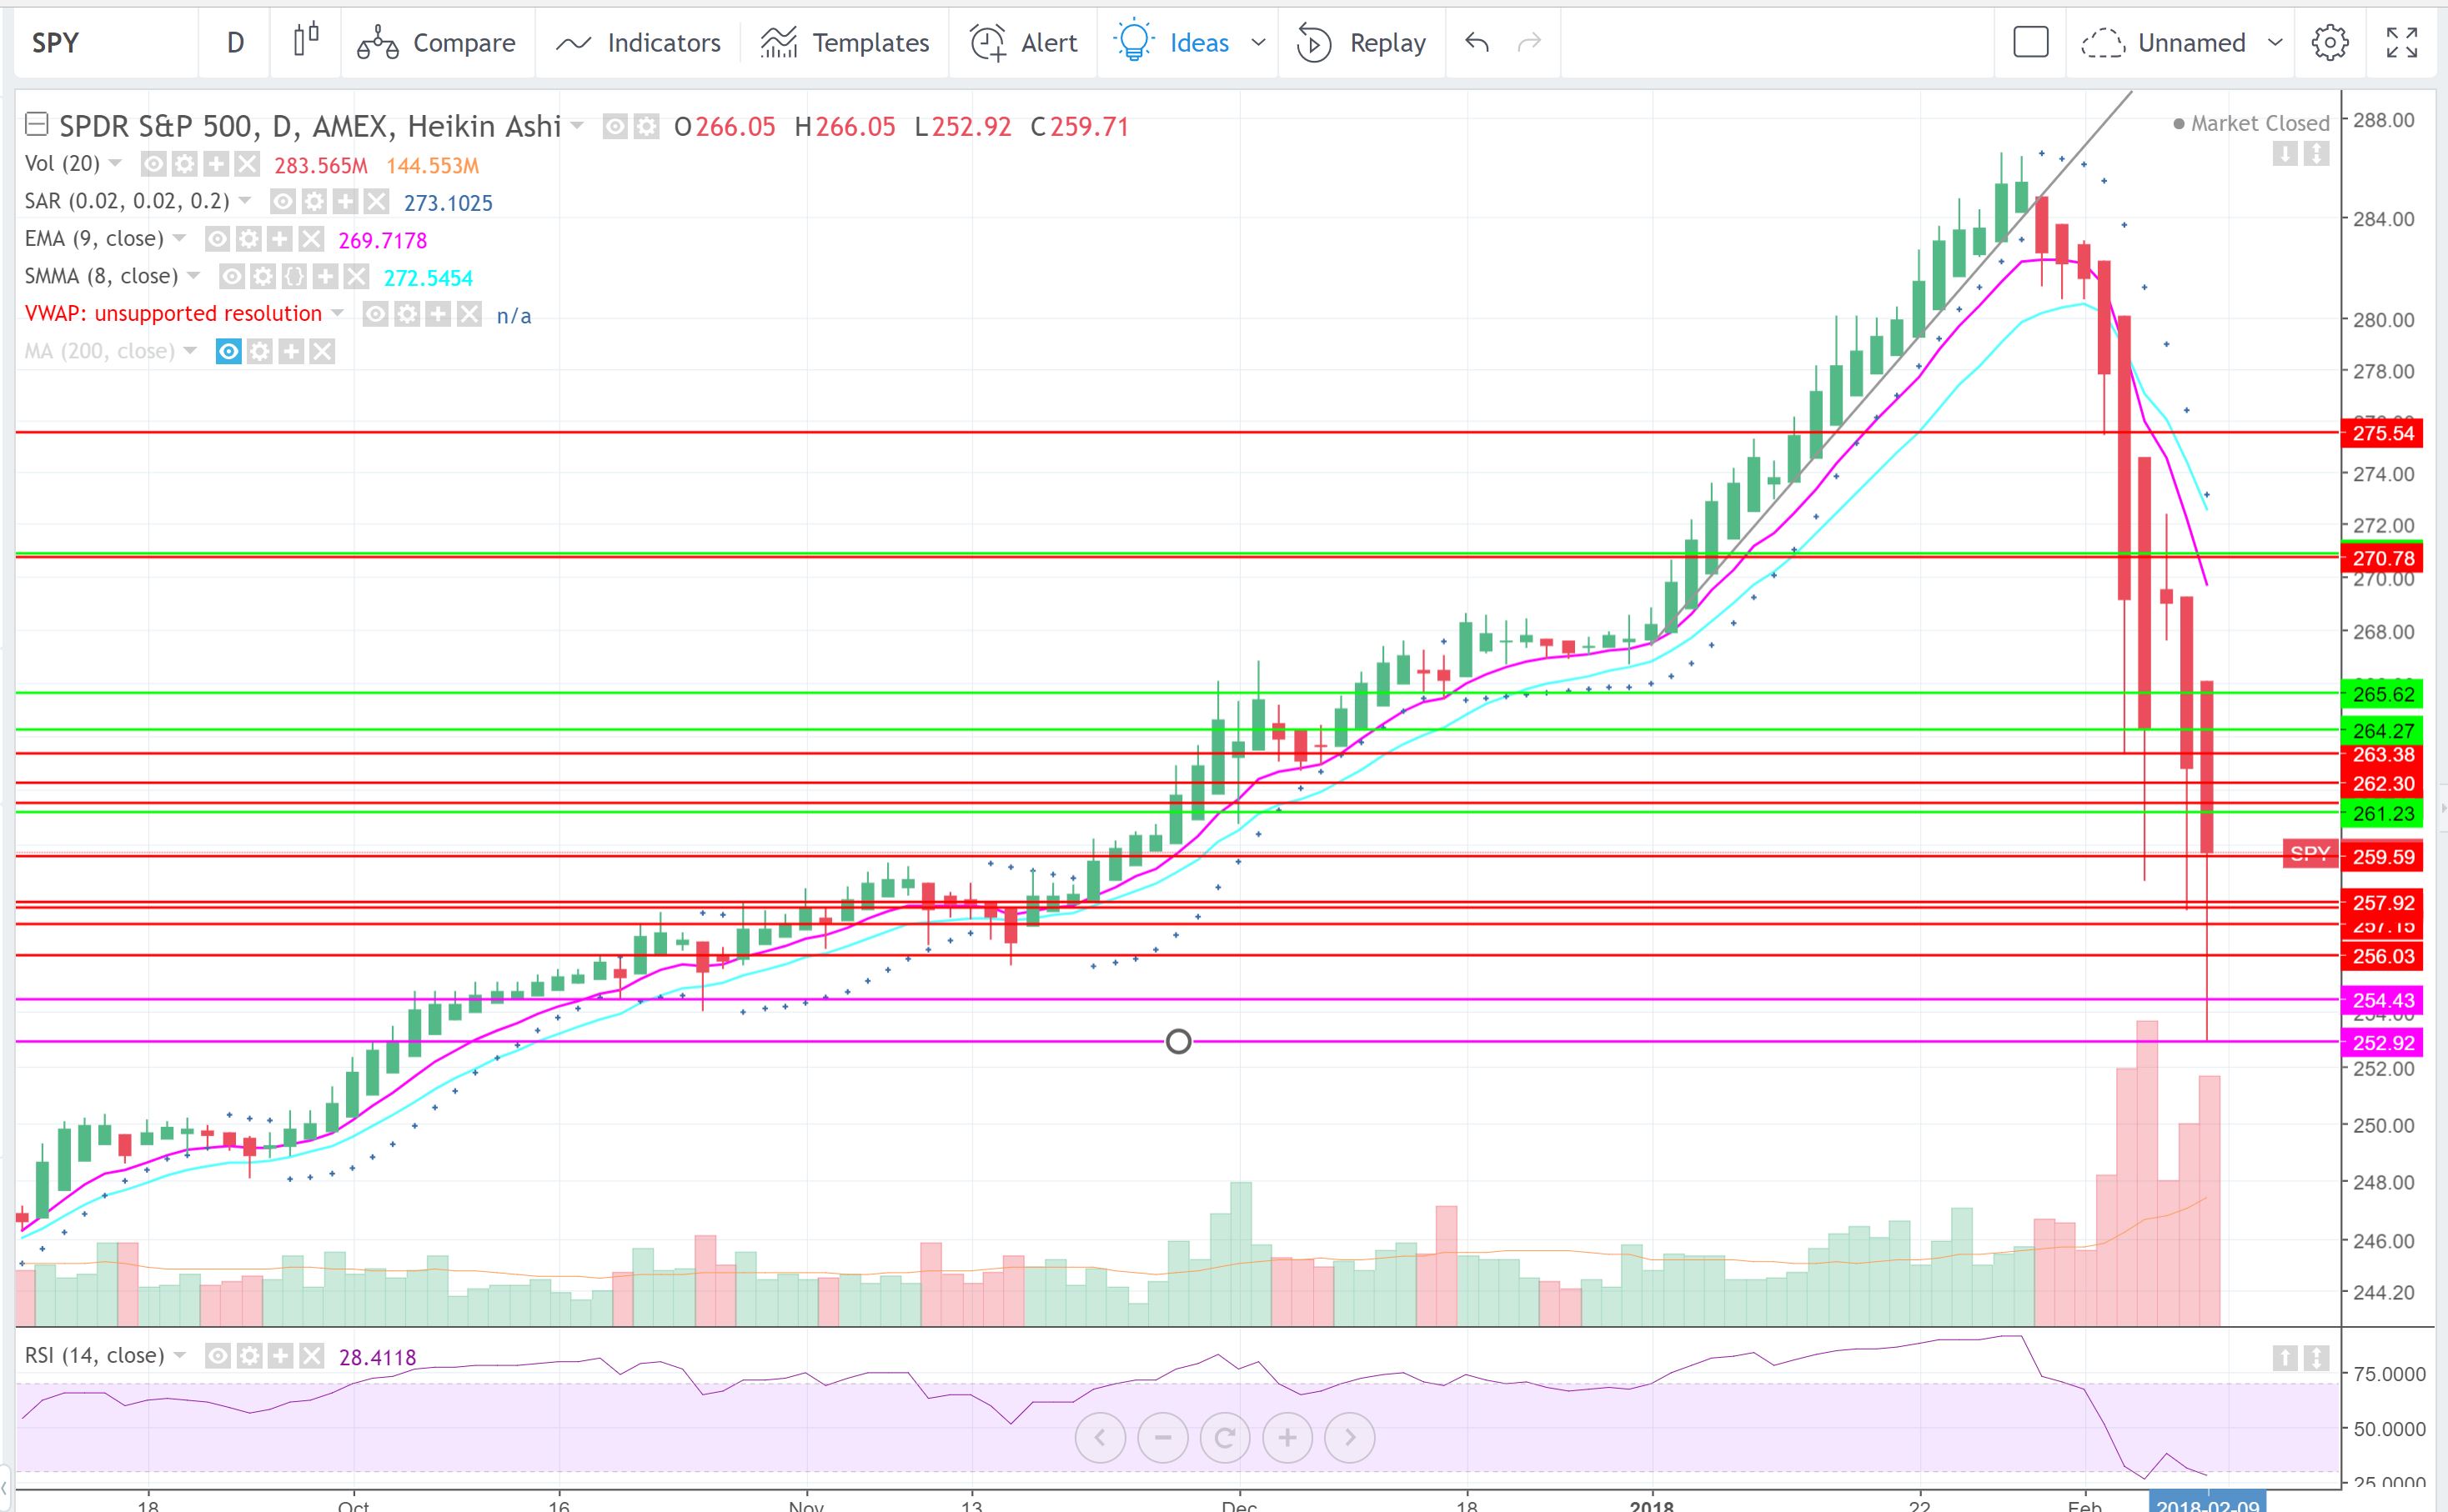
So what do we do now? This is a daily chart of the $SPY. If you are newer to day trading you might not know what SPY, QQQ, IWM mean. To explain them they are the ETFs of the S&P500, Nasdaq and Russell 2000. If you are unsure of what an ETF is click here for the investopedia.com definition. Also if you ever hear a term in trading you don’t understand I recommend popping over to investopedia.com to learn more about the subject. They have amazing definitions about indicators, terms and more.
It’s all over the news its the biggest drop in many years of the market. I used Heikin Ashi candles for the chart which will show you more of the trend of the stock or ETF. When you look at the chart you see that as of Dec 29th the SPY was in a breakout mode for 20+days. It followed the trend and kept growing and growing. Like a low float stock that has had a big run the SPY as well as the stocks in the SPY were showing overbought.
Another indicator that can show when a stock is RSI. As you can see on the chart the RSI reached roughy 91 and anything over 70 is considered overbought and usually will cause a correction. On the flip side any RSI below 30 is considered oversold. Fridays close measured 28.4 on the RSI. This doesnt mean that it won’t continue further down, but a likely indication of a bounce or consolidation before a reversal or continuation of the trend. As yo can see on Tuesday the RSI also dropped below 30 and recovered to then continue in the down trend.
In trading I never rely on just one indicator to make a decision but use them to see a bigger picture.
So back to the question what do we do from here? If you are a long biased trader I would definitely say it is time to practice paper trading. One of the best things this week is shorting or buying puts as the market trend has been bearish. It tends to be easier to go short when the overall trend is bearish and long when the market is bullish.
I have many friends asking me are you ok with this massive drop in the markets. My response is yes. I love all the volatility that this market is bringing. Volatility and Volume are great for price action and liquidity to trade and make profits quickly. There are so many opportunities out there long and short. One of the best things I can recommend it you are newer to trading is really study the market price action and what happens with volume. The catalyst this week for many stock to drop was the overall trend and fear of the stock holders.
You will also see if you look at an intraday chart of the spy there are different times at which you can see reversal or trend changes in charts.
I have people ask me if I’m in any stocks long and I did just re enter OLED at 140.66 for a long term swing again. To me the bounce off of 242 for the SPY is the start of a reversal. I will wait for further confirmation. However if the SPY can stay above 250 for this upcoming week in my opinion we are consolidating and gaining investors confidence to once again invest.
I try to always put myself into the mind of other stockholders to think of what they might be thinking. When the stocks are dropping your average Joe trader gets fearful and then sells and it snowballs into more selling and more selling until an extreme when people see the stock on sale. Like AMZN to me. I think AMZN is on a deep discount down at 1311. I think AMZN would be a good long term swing from here as they are a good value company in my opinion. They just posted biggest earnings ever and with the market trend dropped 200 points. They just announced to further vertically integrate their company with a trial of setting up a delivery service in the LA area. This was a big reason for the drop in UPS and FDX on Friday. And they just poached an NBC exec to help them with their own studios. They are looking to compete directly with Netflix in the streaming content arena.
To me this past week of the market has brought forth many potential long term swing opportunities as we see many stocks large cap and small fall to support levels which are great for longs. It minimizes your risk going long or buying the stock at a support level.
I know you must have many questions and I’m always happy to share what I have learned to help you shorten your learning curve. I was in your shoes a short 3 years ago just beginning my studies of the day trading world. I now wake up everyday and feel incredible blessed to have found it as a career. I remember back in 2009 a friend of mine did it and I said teach me. I never realized how passionate I would be about it and helping others in the same journey.
To help more people in person I set up the Modern Traders Summit which will be June 23rd in Orlando Florida. If you are interested in learning more make sure to check out the website where you can learn about other like minded traders that will be speaking about how they can help you improve as a trader. Seats are selling quickly so make your you secure your spot.
I have also partnered with Tradealike to provide my real time alerts via their mobile app. It is cool because there is no subscription cost and you can pick and choose which alert you would like to purchase.
I love hearing feedback from you. It makes my trading more personal and I like to hear how I can help you. If you have quest.ions or comments you can contact me here or on Profitly, Twitter (@jane_yul), Instagram (missairplanejane), LinkedIn and Facebook (@sugarairplanejane). carpeprofit@gmail.com or YouTube
If you are interested in receiving my morning watchlist email sign up here to receive 3 days free. It is affordable at $19.95 per month, which is roughly $1 per trading day.
My book is available at Amazon FMJ Trust Transition Trade: How Successful Traders Said It, Did It, and Lived It . As well as Barnes and Noble, Indigo, Chapters,and more.
If you want a signed copy please go to the book site
The tool I use for scanning and alerting is Trade Ideas who offer an always free trading room. 15% Off First Month or First Annual – Promo Code CARPETPROFIT15
For my charts I use tradingview.com which offer free charting and paid services
Also Stocks To Trade that has a 1 week $1 trial
For the fastest level 2 I have found I use Equityfeed.
This blog is for information purposes. I am not a registered securities broker-dealer or an investment adviser. The information here is not intended as securities brokerage, investment or as an offer or solicitation of an offer to sell or buy, or as an endorsement, recommendation or sponsorship of any security or fund.